Local Education Data
Equity Measures
A better understanding of our educational systems empowers us to advocate for changes that can improve outcomes and equity.
What are Equity Measures?
While the disaggregated data provided via the core measures helps us better understand disparities in outcomes, equity measures have been selected to help us understand critical aspects of educational equity in practice in our community, such as disproportionate discipline practices, segregation, access to resources, and diversity of educators and staff.
The Forsyth Promise’s goal is to support improvement of community-wide education outcomes for all students and support the reduction (and ultimate elimination) of disparities in outcomes by race/ethnicity and socioeconomic status.
The Forsyth Promise Data Exchange
We are sharing community information so that everyone can better understand our educational systems. This resource is kept up to date as local data sources are updated through a partnership between The Forsyth Promise and Forsyth Futures.
We Value Your Feedback
If you have a question about The Forsyth Promise Data Exchange, please email info@forsythfutures.org.
Disparities in educational opportunities and outcomes exist among students based on socioeconomic status, gender, race/ethnicity, geography, and other factors — resulting from a history of systemic inequities.

The Forsyth Promise believes that every student should have what they need to reach their full potential. Thus, educational equity is achieved when all students have access to the necessary resources, based on their individual needs, to meet their potential.
We recognize and acknowledge that significant disparities in educational opportunities and outcomes exist among students based on socioeconomic status, gender, race, and special needs — resulting from a history of systemic inequities.
We further recognize that an important step in the pursuit of equity is to better understand systems of inequity. The measures presented here represent a first step in illuminating some of the conditions that are directly connected to pressing aspects of educational equity in WS/FCS. We welcome the community’s input as we identify additional measures that would prove helpful as we assess performance in this area.
Key Findings from the Equity Measures
Students of color are suspended at higher rates than White students.
Title I and schools with lower performance grades have fewer experienced and/or highly effective teachers.
Did you know?
Winston-Salem/Forsyth County Schools has a strategic plan that is designed to improve many of the educational outcomes that you’ll find in the TFP Data Exchange.
Student Supports and Environment (School Climate)
School climate represents the quality and character of life in school. Positive school climate can help provide a strong protective factor for youth that contributes to positive youth development, improved academic performance, and decreased chances that youth get involved in high-risk behaviors such as truancy, disciplinary actions, and gang-involvement.
Three measures show student supports and environment – cultural awareness and action, rigorous expectations, and sense of belonging. These measures are defined by Panorama, the assessment platform used by WS/FCS, as follows:
- Cultural awareness and action: How often students learn about, discuss, and confront issues of race, ethnicity, and culture in school.
- Rigorous expectations: How much students feel that their teachers hold them to high expectations around effort, understanding, persistence, and performance in class.
- Sense of belonging: How much students feel that they are valued members of the school community.
Data Visualization
Student Supports and Environment (2020-21 School Year)
Use the dropdown menu below to view data on different groups.
Key Takeaways
Elementary school students were above average on school climate.
Compared to national levels, WS/FCS elementary school students were above average on rigorous expectations (60-79th percentile) and sense of belonging (80th-99th percentile).
Middle and high school students were below average on school climate.
Compared to national levels, WS/FCS middle and high school students were below average on cultural awareness and action (20-39th percentile), rigorous expectations (20th-39th percentile), and sense of belonging (0th-19th percentile).
What is "Percent Favorable?"
Disproportionate Discipline
Time that students spend out of the classroom for disciplinary reasons can disrupt learning. Unfortunately, students of color are more likely to receive a suspension which contributes to disparities in educational outcomes.
The measure used here is the risk ratio. The risk ratio is the likelihood a child of a given race/ethnicity is to be referred for an incident compared to the average referral for a white student (group with the lowest referral rate for an incident). Incidents can lead to different types of discipline including in-school suspension, out-of-school suspension, parent conference, etc. Data from the 2020-21 school year is not available due to COVID disruptions — students were not in schools for a significant portion of the school year.
Data Visualization
Discipline Referral Risk Ratio (2016-20 School Years)
Key Takeaways
Black students were 3.35 times more likely than White students to be referred for an incident while Hispanic/Latino students were 1.82 times more likely than White students in the 2019-2020 school year.
Data Notes
Student Supports and Environment (School Climate)
The following definitions are provided by Panorama (the assessment platform used by WS/FCS):
What is “Percent Favorable?” A score of “81% favorable” means that 81% of respondents selected a favorable answer choice. Most often, the top two answer choices are favorable for a question with five answer choices, and the top three answers choices are favorable for a question with seven answer choices.
What is “Compared to Others Nationally?” To help put results in context, Panorama compares each topic score to the average score for schools or districts in Panorama’s national dataset. For example, while one of your topic scores may appear low compared to another topic score, you may find that the score is higher than the average topic score for other schools in the nation. Use this comparison to find areas of strength and areas for improvement.
Data source: Winston-Salem/Forsyth County Schools
Data Notes
Discipline Incident Rate
Data source: Winston-Salem/Forsyth County Schools
Teacher Effectiveness
Highly effective teachers and teachers who have more experience can have a dramatic impact on student performance and success in school.
The two measures included here are teacher effectiveness and teacher experience. Teacher effectiveness is determined by an evaluation of teachers across five standards: teacher demonstrates leadership, teacher establishes a respectful environment for a diverse population of students, teacher knows the content they teach, teacher facilitates learning for their students, and teacher reflects on their practice. A rating of ‘needs improvement’ signifies a teacher did not meet proficiency on at least one of the five ratings; a rating of ‘effective’ means they were at least proficient on all standards, and highly effective means they met ‘accomplished’ or ‘distinguished’ on all five standards.
Teacher experience defines beginning teachers as teachers who are in their first three years of teaching. View data notes for this measure.
Data Visualization
Teacher Effectiveness and Experience (2018-19 School Year)
Use the dropdown menus below to view data on different measures and groups.
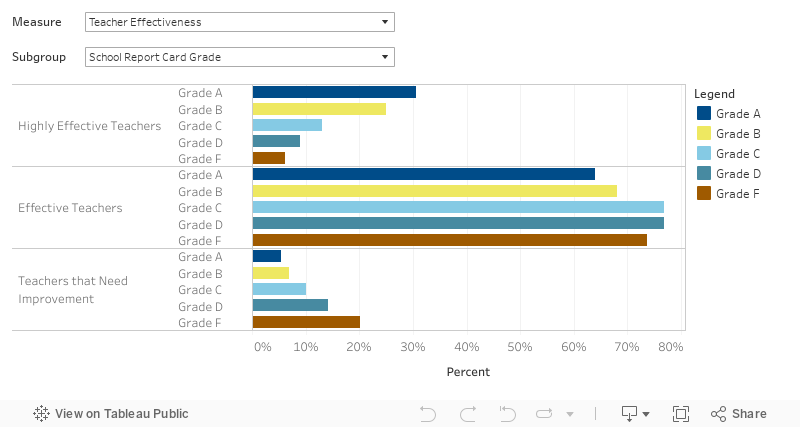
Key Takeaways
There are fewer highly effective teachers at Title I and lower letter grade schools.
There are more beginning teachers at Title I and lower letter grade schools.
Data Notes
Teacher Effectiveness and Experience
Title I schools are schools where more than 55% of students are on free or reduced price lunch.
School letter grade is assigned to a whole school and is based on a school’s overall student proficiency and growth on testing results.
Data source: North Carolina Department of Public Instruction
Educator and Staff Diversity
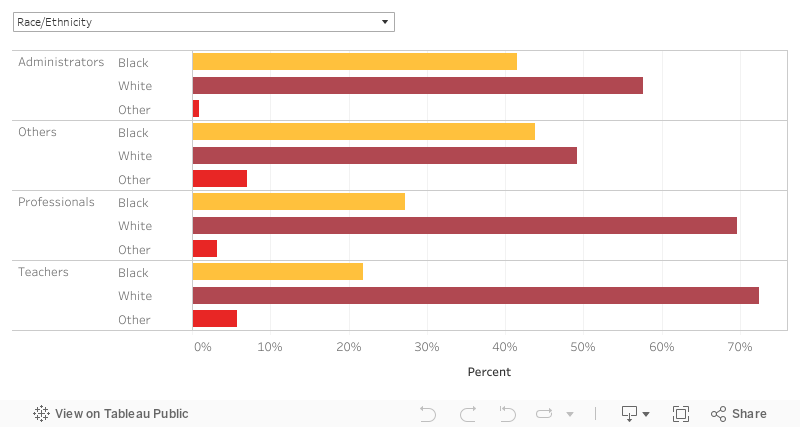
A diverse school staff that is representative of the student body is one important way to help equalize opportunities for students of color.
Data Visualization
WS/FCS Staff Diversity
Use the dropdown menu below to view data on different groups.