
The Forsyth Promise 2020 Education Report
The purpose of this report is share community information so that everyone can better understand our educational systems. This report is produced annually by The Forsyth Promise.
We Value Your Feedback
Please use this Google form to provide feedback.
Local Education Data
Core Education Measures
A better understanding of our educational systems empowers us to advocate for changes that can improve outcomes and equity.
What are Core Education Measures?
Core education measures help us understand critical outcomes within our educational systems like third grade reading proficiency, ACT proficiency, and high school graduation. Core education measures span the cradle-to-career spectrum, from early childhood to higher education, and feature interactive data visualizations built from reliable, high-quality data analysis. Many measures are disaggregated by race/ethnicity, socioeconomic status, and other variables.
Data visualizations for the 2020 report are set to show disaggregated data by race/ethnicity by default to highlight the major disparities in outcomes faced by students of color in Forsyth County.
The Forsyth Promise’s goal is to support improvement of community-wide education outcomes for all students and support the reduction (and ultimate elimination) of disparities in outcomes by race/ethnicity and socioeconomic status.
The following data convey how Forsyth County is doing in regard to our most critical education measures.
The Forsyth Promise’s goal is to support improvement of community-wide education measures for all students and support the reduction (and ultimate elimination) of disparity gaps by race/ethnicity and socioeconomic status.

Pathways to Action
Help Us Build a More Complete Perspective
We need your help to learn more about our local educational systems.
A goal with this yearly report is to provide more comprehensive data with each successive iteration. The following potential measures have been identified as having community value:
- vocational training
- job placement
If you are interested in helping The Forsyth Promise grow and learn in these or other areas please let us know as we work to incorporate data for these two topics in next years report.
Key Findings from the Core Education Measures

Disparities by race/ethnicity are present across all measures for which disaggregated data is available.
Major disparities between Black and Hispanic/Latino students compared to White students are present in all measures where disaggregated data is available except for High School Graduation. For that indicator disparities are present but not as pronounced.

Disparities by economic status are present across all measures for which disaggregated data is available.
Major disparities between economically disadvantaged students compared to non-economically disadvantaged students are present in all measures where disaggregated data is available except for High School Graduation. For that indicator disparities are present but not as pronounced.

When trend data is available, outcomes are either remaining stable or declining.
High School Graduation, College Enrollment, and College Completion measures are about the same across the period where data is available. Third Grade Reading and College Preparation measures are declining across the period where data is available.
Kindergarten Readiness
The years before Kindergarten are critical for the healthy development of a child’s mind, body, and capacity to learn later in life. Many children enter Kindergarten without the skills necessary to excel in reading and are at risk of falling behind their peers. The Istation assessment is an early literacy skills assessment. Istation defines proficiency as those who are likely to do well in reading in later grades. This report uses the Istation middle of year (MOY) assessment for Kindergarteners. View data notes for this measure.
Data Visualization
Kindergarteners Proficient on MOY IStation (2019-20 School Year)
Use the dropdown menu below to view data on different groups.

Key Takeaways
The majority of Kindergarten students were not proficient.
Only 25% of Kindergarten students were proficient on the middle of year Istation reading assessment.
Disparities were present in proficiency levels by race/ethnicity.
Black and Hispanic/Latino Kindergarten students had lower proficiency levels in the middle of year Istation reading assessment compared to their White peers.

Stories of Lived Experience
“If children aren’t exposed to childcare, they aren’t exposed to any type of extracurricular learning.”
NATASHIA ALEXANDER, Parent of a Kindergartener in WS/FCS; Child Care Resource Center
Go to the lived experience interviews
Data Notes
Kindergarteners Proficient on MOY IStation
Trend data is not available because the 2019-20 school year was the first year that the Istation assessment was administered. The prior assessment was the Dynamic Indicators of Basic Early Literacy Skills (DIBELS).
Data source: Winston-Salem/Forsyth County Schools
Third Grade Reading
Children who are unequipped with basic reading skills at the end of third grade are at much greater risk of falling behind in school. After third grade, instruction transitions from “learning to read” to “reading to learn.” This measure is based on the reading test taken at the end of third grade; proficiency on this test is defined as possessing the skills required to read at a third grade level. View data notes for this measure.
Data Visualization
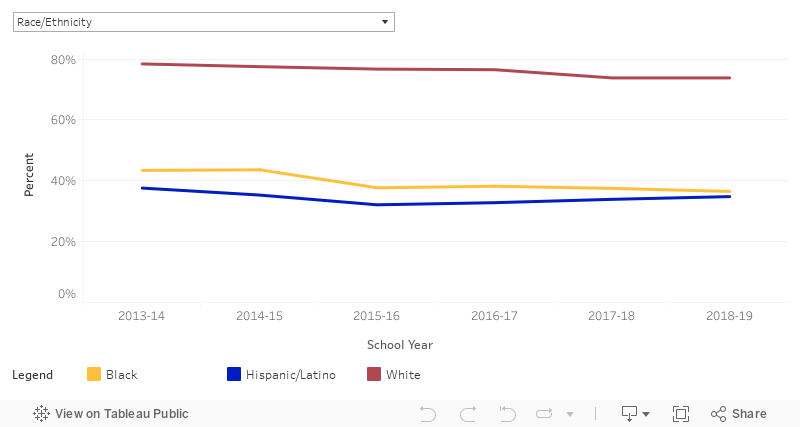
Grade-level Proficiency on End of Grade Third Grade Reading Test (2013-19 School Years)
Use the dropdown menu below to view data on different groups.
Key Takeaways
Approximately half of third grade students were proficient in the 2018-19 school year.
In the 2018-19 school year, 52% of third grade students were proficient on the end of grade reading assessment. The percent of students who were proficient decreased from 58% in the 2013-14 school year to 52% in the 2018-19 school year.
Disparities were present in proficiency levels by race/ethnicity.
African American and Hispanic/Latino students had lower levels of proficiency on the end of grade reading assessment in the 2018-19 school year compared to their White peers.
Disparities were present in proficiency by student economic status.
Economically disadvantaged students had lower levels of proficiency on the end of grade reading assessment in the 2018-19 school year compared to students who were not economically disadvantaged.
Data Notes
Grade-level Proficiency on End of Grade Third Grade Reading Test
Economic disadvantage is defined as students who are receiving free- or reduced-price lunch.
Data from the 2019-20 school year is not included because end of grade testing did not take place.
Data source: North Carolina Department of Public Instruction
Eighth Grade Math
Math is a critical way to measure and understand the world with greater precision. Many careers in the modern economy require a strong foundation in math. Math skills in eighth grade are a predictor of success in post-secondary education. The measure used for Math Proficiency is the eighth grade math test taken at the end of eighth grade. Proficiency on this test is defined as the skills required to do math at an 8th grade level. View data notes for this measure.
Data Visualization
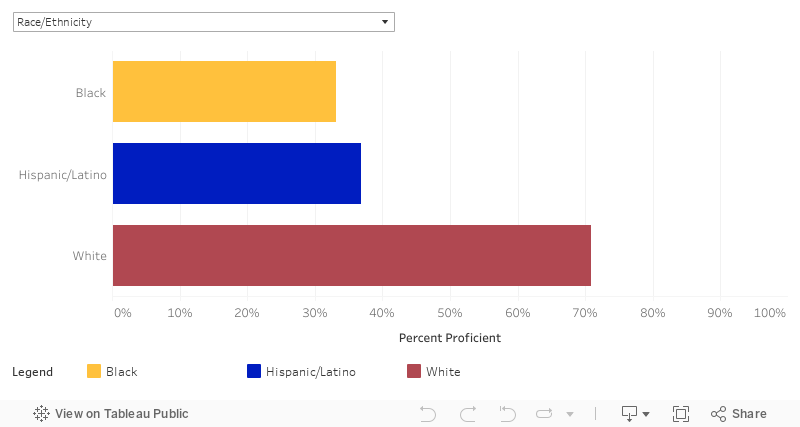
Grade-level Proficiency on End of Grade Eighth Grade Math Test (2018-19 School Year)
Use the dropdown menu below to view data on different groups.
Key Takeaways
Approximately half of eighth grade students were proficient in the 2018-19 school year.
In the 2018-19 school year, 51% of students who took the end of grade eighth grade math test were proficient.
Disparities were present in proficiency levels by race/ethnicity.
Black and Hispanic/Latino students were proficient on the end of grade math assessment in the 2018-19 school year at half the rate of their White peers.
Disparities were present in proficiency by student economic status.
Economically disadvantaged students were proficient on the end of grade math test in the 2018-19 school year at half the rate of their non-economically disadvantaged peers.
Stories of Lived Experience
“Academic success for each child requires equal resources and support.”
TONYA L. WOODS, Parent of a 5th Grade WS/FCS Student
Go to the lived experience interviews
Data Notes
Grade-level Proficiency on End of Grade Eighth Grade Math Test
Economic disadvantage is defined as students who are receiving free or reduced price lunch.
Trend data is not included because the standards were changed for the 2018-19 school year.
Data from the 2019-20 school year is not included because end of grade testing did not occur.
Data source: North Carolina Department of Public Instruction
Stories of Lived Experience
“I also think we have to really check in on kids, to see what their mental state is. This pandemic is affecting our young people. Some are ready to give up on school, because they are tired of being on the computer.”
MRS. SYLVIA ADAMS, Executive Director, The Salvation Army Ken Carlson Boys & Girls Club
Go to the lived experience interviews
College Preparation
Colleges expect incoming students to have the skills and knowledge necessary to tackle college coursework. Students who are unprepared for college often spend time and money on remediation once they get to college, which greatly decreases their chances of success and degree completion. The American College Testing (ACT) assessment is taken by all 11th grade students in North Carolina. In North Carolina, proficiency on the ACT is defined as a composite score of 17 or above – the minimum score required for admission into the University of North Carolina system. View data notes for this measure.
Data Visualization
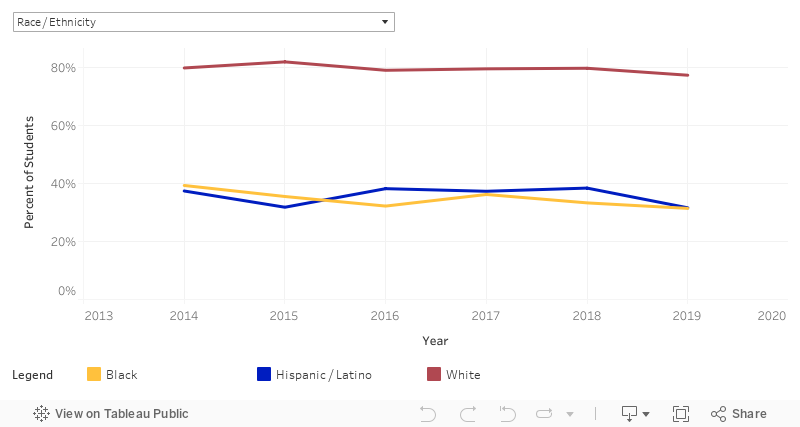
Students Meeting ACT Proficiency (2013-19 School Years)
Use the dropdown menu below to view data on different groups.
Key Takeaways
Approximately half of eleventh grade students were proficient in the 2018-19 school year.
In the 2018-19 school year, 54% of eleventh grade students were proficient on the ACT test.
Disparities were present in proficiency levels by race/ethnicity.
Black and Hispanic/Latino students were proficient on the ACT in the 2018-19 school year at less than half the rate of their White peers.
Disparities were present in proficiency levels by student economic status.
Economically disadvantaged students were proficient on the ACT test in the 2018-19 school year at less than half the rate of their non-economically disadvantaged peers.
Data Notes
Students Meeting ACT Proficiency
Economic disadvantage is defined as students who are receiving free- or reduced-price lunch.
Data source: North Carolina Department of Public Instruction
High School Graduation
In today’s economy, people with a high school diploma have better employment prospects. Increasingly, a person who lacks a high school diploma is more likely to live in poverty, suffer from poor health, and engage in crime. The measure used for High School Graduation is the four-year graduation rate, which is considered to be on-time graduation for high school students. View data notes for this measures.
Data Visualization
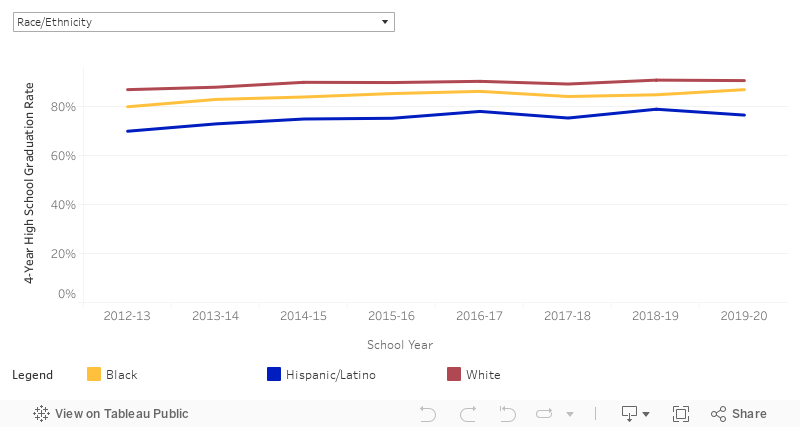
Four-Year High School Graduation Rate (2012-20 School Years)
Use the dropdown menu below to view data on different groups.
Key Takeaways
Most high school students graduated within four years.
In the 2019-20 school year, 86% of high school students who entered high school in the 2016-17 school year graduated on time (meaning to graduate within four years of entering high school).
Disparities were present in four-year graduation rates by race/ethnicity.
Slightly fewer Black students than White students graduated in four years, 87% compared to 91%. Fewer Hispanic/Latino students graduated in four years (77%) compared to their Black and White peers.
Slight disparities were present in four-year graduation rates by student economic status.
Fewer economically disadvantaged students graduated on time (83%) compared to their non-economically disadvantaged peers (87%).
Slight disparities were present in four-year graduation rates by gender.
Fewer male students graduated on-time (82%) compared to female students (90%).
Data Notes
Four-Year High School Graduation Rate
Only two years of data are included because the way that the graduation rate is calculated changed for the 2017-18 school year.
Economic disadvantage is defined as students who are receiving free- or reduced-price lunch.
Data source: North Carolina Department of Public Instruction
College Enrollment
Many high school graduates do not take this critical first step toward post-secondary educational attainment. This measure represents the percentage of high school graduates who enroll in college during the fall after graduation. The school year included in the data visualization is the year of high school graduation. View data notes for this measure.
Data Visualization
College Enrollment in the Fall After High School Graduation (2012-19 School Years)
Use the dropdown menu below to view data on different groups.

Key Takeaways
Slightly more than half of high school graduates enrolled in college.
57% of the high school graduates from the 2018-19 school year enrolled in college the fall after graduation.
Disparities were present in college enrollment by race/ethnicity.
Fewer Black and Hispanic/Latino students than White students enrolled in college during the fall after high school graduation: 50%, 40%, and 70%, respectively.
Disparities were present in college enrollment by student economic status.
Fewer economically disadvantaged students enrolled in college (41%) compared to students who were not economically disadvantaged (65%) during the fall after high school graduation.
Slight disparities were present in college enrollment by gender.
Fewer males enrolled in college (52%) compared to females (62%) during the fall after high school graduation.
Stories of Lived Experience
“The Upward Bound program was critically important in assisting me with the roadmap of how to get to college and locate the financial resources that would assist me in achieving my goals.”
TONYA L. WOODS, Parent of a 5th Grade WS/FCS Student
Go to the lived experience interviews
Data Notes
College Enrollment in the Fall After High School Graduation
Economic disadvantage is defined as students who are receiving free or reduced price lunch.
Data source: National Student Clearinghouse
College Completion
Post-secondary education, attained after high school, plays a key role in upward mobility. This includes colleges, community colleges, and universities, among others. This measure reflects the percentage of Winston-Salem/Forsyth County Schools high school graduates who complete a degree within six years of high school graduation. View data notes for this measure.
Data Visualization
Six-Year College Completion (Graduates from 2012-14)
Use the dropdown menu below to view data on different groups.
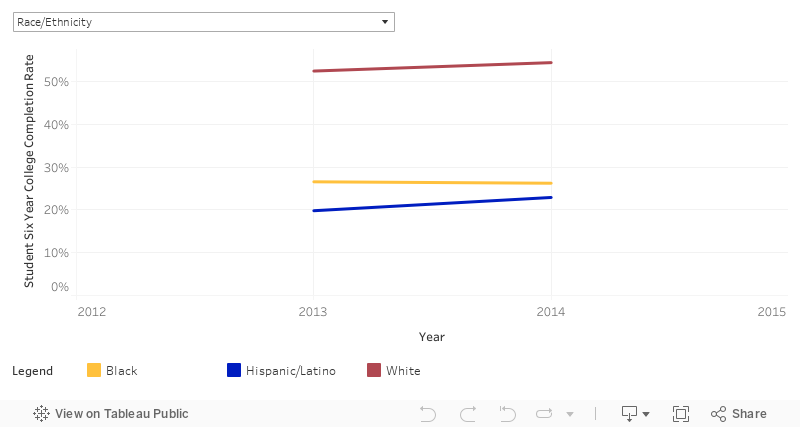
Key Takeaways
Fewer than half of high school graduates completed college six years after high school graduation.
40% of high school graduates from the 2013-14 school year completed college within six years of high school graduation.
Disparities were present in college completion by race/ethnicity.
Black (26%) and Hispanic/Latino (23%) high school graduates completed college within six years of high school graduation — less than half the rate compared to White high school graduates (54%).
Disparities were present in college completion by student economic status.
High school graduates who were not economically disadvantaged completed college within six years of high school graduation at more than twice the rate of high school graduates who are economically disadvantaged, 53% and 21%, respectively.
Disparities were present in college completion by gender.
Fewer males completed college (35%) compared to females (45%) within six years of high school graduation.
Data Notes
Six-Year College Completion
This measure represents the percentage of high school graduates who complete a post-secondary degree, Bachelor’s or Associates, from the high school graduate class of 2012-13 within six years of high school graduation (2019).
Economic disadvantage is defined as students who are receiving free- or reduced-price lunch.
Race/ethnicity and economic status disaggregation is not available for the high school class of 2012.
Data source: National Student Clearinghouse
Pathways to Action
We can work together to organize, advocate, and drive positive change.
When we work together, we have the power to change our systems for the better. We hope those who read this report feel encouraged and inspired to get involved. Local groups are working to support and improve our systems and there are many ways for anyone to get involved.

Get Engaged in the Community Conversation on Education
Join us for Be The Change: Making Good on Our Promise, a digital convening designed to bring people together and discuss coordinated community-wide action to increase equity and improve outcomes.

Learn About Work Being Done to Improve Our Educational Systems
Initiative Action Profiles highlight current, collaborative, community work to improve our systems of education.

Help Improve this Report by Sharing Your Feedback
Each year, The Forsyth Promise publishes a community report on Forsyth County's educational systems. By taking just a moment to share your thoughts on the 2020 report, you can help make future reports better.
Help Us Build a More Complete Perspective
Help us understand important aspects of our educational systems that this report may have overlooked or suggest new information to improve the report.

Find a Volunteer Opportunity that's Right for You
Everyone in our community possesses important gifts, skills, and talents they can use to help make Forsyth County a better place to live.

Share the Story of Your Lived Experience
Forsyth County residents of all ages, lifestyles, and backgrounds can participate in our Lived Experience Lab, through which we capture and share critical community stories about educational experiences.
Social and Emotional Learning
Research has shown that Social and Emotional Learning (SEL) skills are a critical component of academic success. Students who participate in evidence-based SEL programs (compared to students who did not) see improved academic outcomes, better classroom behavior, an increased ability to manage stress and depression, and better mindsets and attitudes about themselves and others.
Four measures show student SEL skills — grit, growth mindset, self-efficacy, and self-management. These measures are defined by Panorama, the assessment platform used by WS/FCS, as follows:
View data notes for this measure.
Data Visualization
Social and Emotional Learning (2019-20 School Year)
Use the dropdown menu below to view data on different groups.
Key Takeaways
Elementary school students were average or above average on SEL skills.
Compared to national levels, WS/FCS elementary school students were above average on growth mindset (80-99th percentile) and self-efficacy (60-79th percentile), and about average on grit (40-59th percentile) and self-management (40-59th percentile).
Middle and high school students were below average on most SEL skills.
Compared to national levels, WS/FCS middle and high school students were below average on grit (20-39th percentile), growth mindset (20-39th percentile), and self-efficacy (20-39th percentile), and about average on self-management (40-59th percentile).